Introduction
Based on a few benchmark tests, the parallel performance and scalability of the CFD code CFX on the system VILJE will be presented. Simulations were performed up to 512 CPU cores, with the ANSYS CFX version 19.1. These benchmark tests were performed as a part of Nordvik’s master thesis [1]; “Variable speed operations of Francis turbines”. It was also a part of the study from Nordvik et al. [2].
Test case
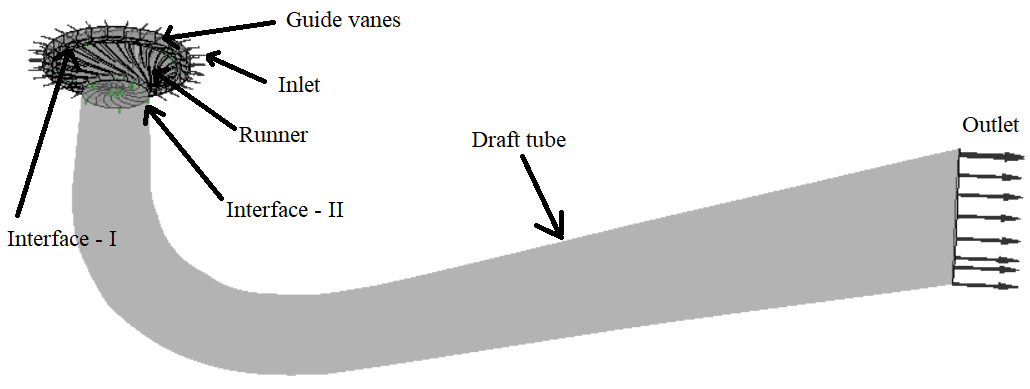
The parameters chosen in the case are presented in Table 1 below. The chosen benchmark case is based on the simulation of internal flow of the Francis-99 runner [3]. More details about the flow parameters and results can be found in [1]. In Figure 1, the computational domain with boundary conditions are shown. The inlet and outlet boundary condition were total pressure and static pressure, respectively. Interface-I and II were connected with Frozen rotor interface between the stationary and the rotating domain. These benchmark tests were performed at best efficiency point (BEP) with runner speed equal to 320.13213 [rev min^-1] and guide vane angle at 9 [degree].
Figure 1. Computational domain of the model Francis turbine with two interfaces namely guide vane to runner (interface–I) and runner to draft tube (interface–II).
|
Analysis type |
Steady-state |
|
Precision |
Double precision |
|
Turbulence model |
Standard k-ε - model |
|
Number of iterations |
1000 |
|
Mesh size |
11 803 022 |
|
Turbulence numerics/Advection scheme |
High resolution |
|
Physical timescale |
Auto timescale Conservative |
|
Wall function |
Scalable |
Table 1. Simulation parameters
Results
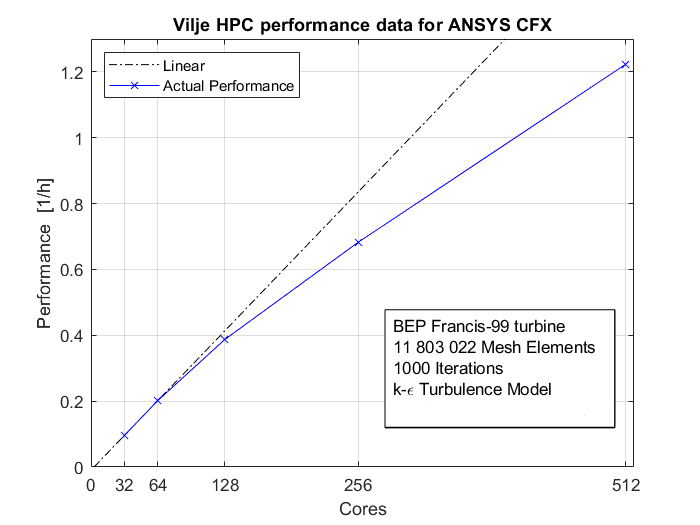
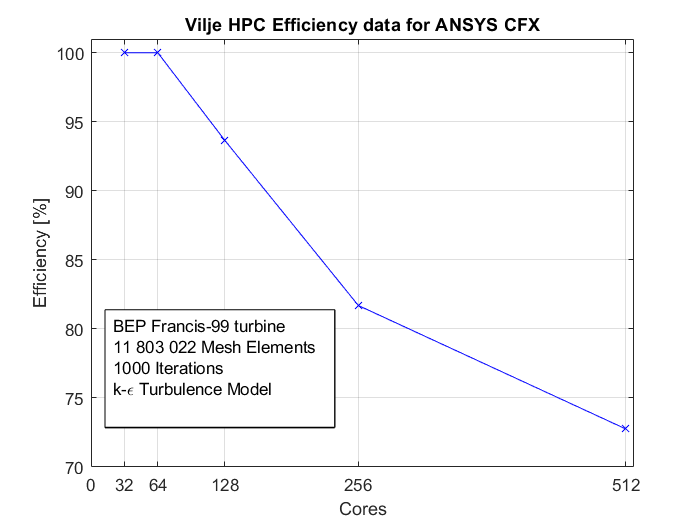
Simulations are performed for 1000 iterations for each simulation. The time step size is set to Auto timescale Conservative. The double precision performance is measured based on the total of wall clock time for 1000 iterations. Figure 2 shows the performance against CPU cores. Figure 3 shows the simulations efficiency, which is a comparison be Performance is defined here as 1/simulation time [1/hr], whereas the efficiency in Figure 3 is defined as x100 where and is the linear and actual performance, respectively.
Figure 2. Vilje efficiency (linear to actual performance).
Figure 3. Vilje performance [1/hour].
Conclusions
From this benchmark, one sees almost a linear drop in simulation efficiency between 64 and 256 cores. The relative speedup from 64 to 128 cores was 1.92, whereas from 128 to 256 cores gave 1.76 relative speedup. To achieve high performance, as well as a reasonable efficiency, it might be more advantageous to do simulations using 128 cores (8 nodes). However, it is important to keep the limitations of licenses in mind; using 128 cores demands 128 ANSYS licenses.
References
[1] A. Nordvik, “Variable speed operations of Francis turbines,” Master Thesis, NTNU, Produktutvikling og produksjon, Energi-, prosess- og strømningsteknikk, 2019
[2] A. Nordvik, I. Iliev, C. Trivedi, and O. G. Dahlhaug, “Numerical prediction of hill charts of francisturbines,”Journal of Physics: Conference Series, vol. 1266, p. 012011, jun 2019, Url: https://doi.org/10.1088/1742-6596/1266/1/012011.
[3] “Norwegian hydropower center, Francis 99.” URL: https://www.ntnu.edu/nvks/
francis-99.


